Stay informed with the latest trends shaping the Pittsburgh commercial real estate market. Dive into our Quarterly Market Reports for key insights, market activity, and an in-depth look at the trends impacting the region.
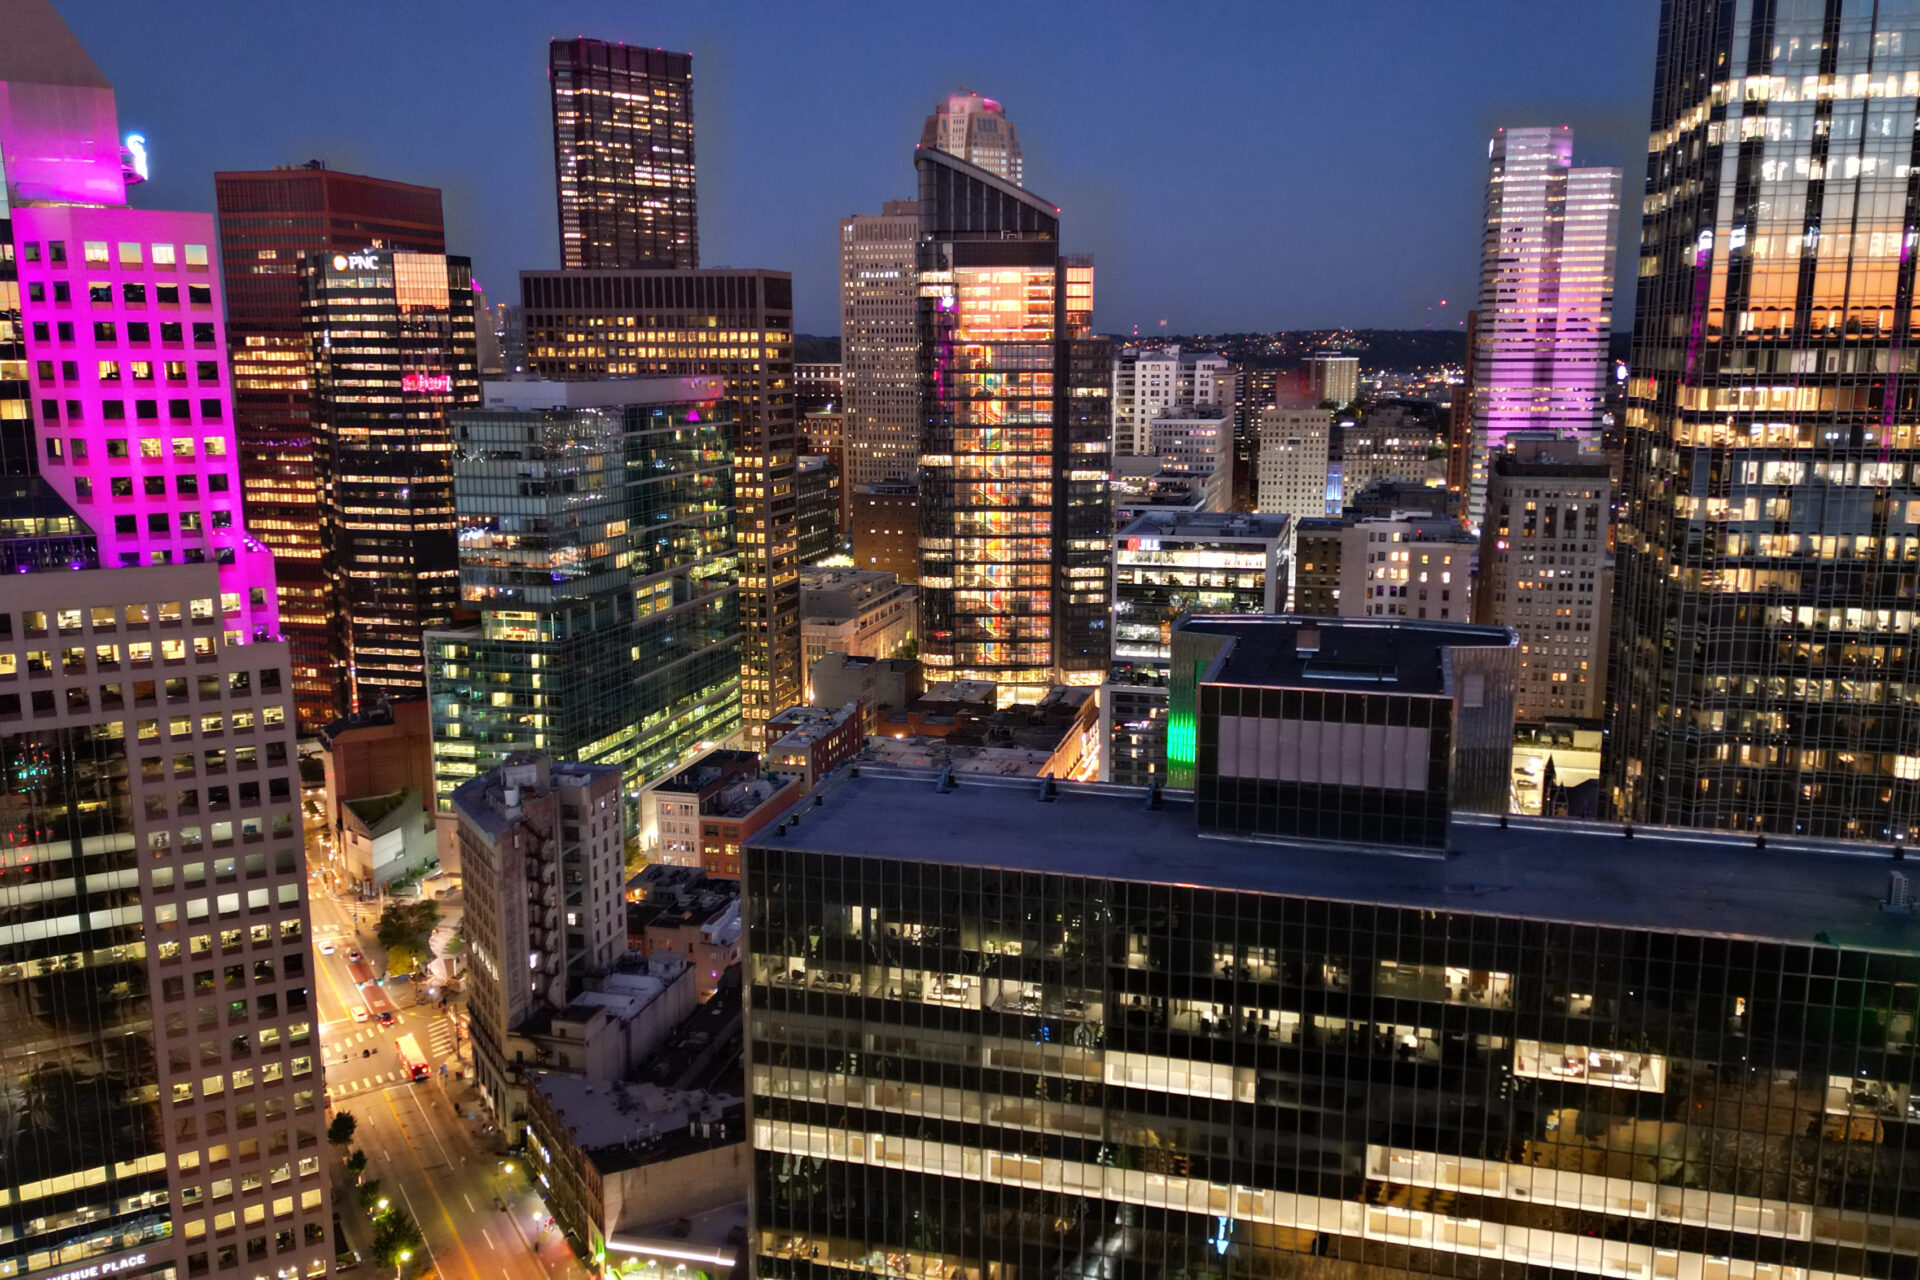
OFFICE – Pittsburgh office conditions remained steady but selective in the second quarter. Availability declined from 11.3% in Q1 to 10.3% in Q2, while total vacancy edged up from 9.7% to 9.8%, reflecting continued unevenness by asset quality and submarket. The market record 104,311 SF of negative quarterly absorption, although year-to-date absorption remained positive at 328,935 SF. Construction activity totaled 220,187 SF, keeping the development pipeline limited. Leasing demand continued to favor high-quality, amenitized suburban space and specialized users, while Downtown’s aging inventory advanced through residential and mixed-use conversion proposals. The resulting recovery remains measured, with stronger performance concentrated in modern buildings and obsolete space increasingly targeted for alternative uses.
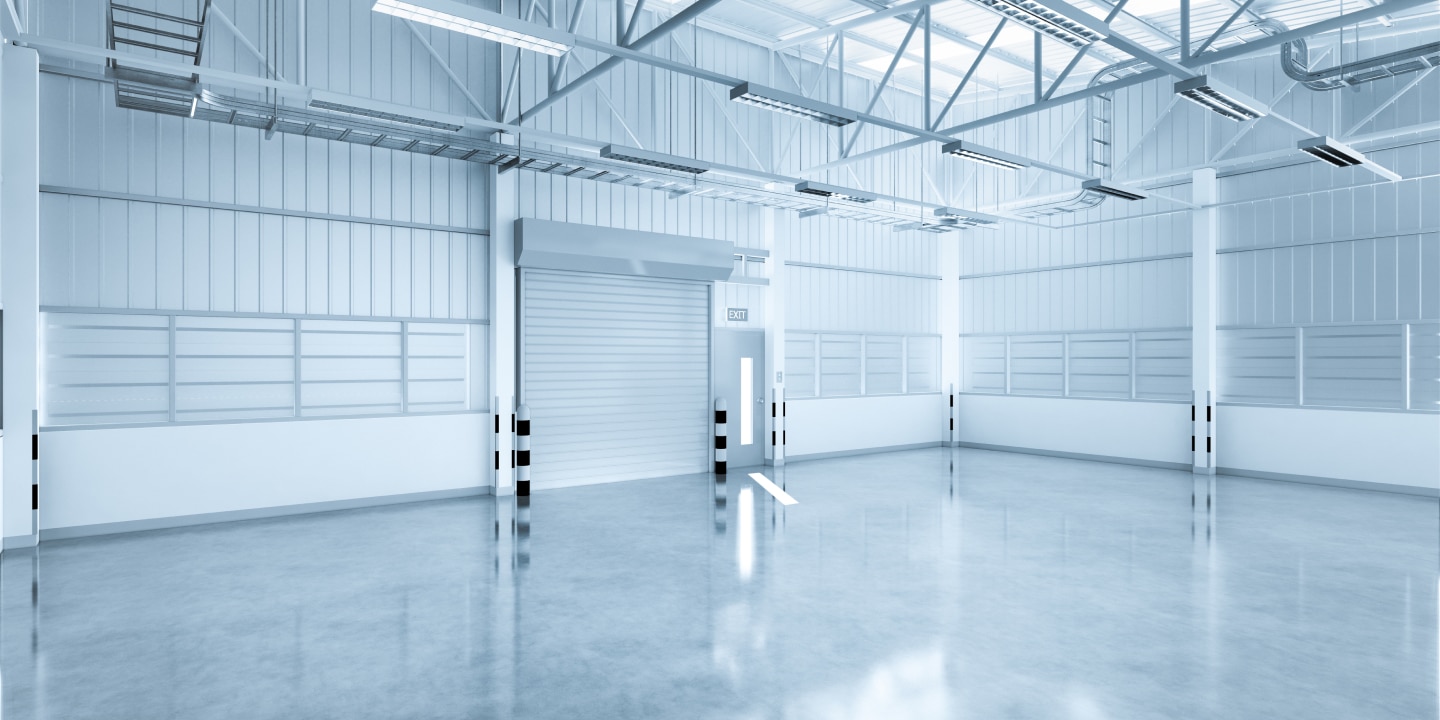
INDUSTRIAL – Industrial fundamentals strengthened in the second quarter, supported by positive absorption and continued investment in modern production and logistics facilities. Total vacancy decreased from 5.8% in Q1 to 5.5% in Q2, while availability was 6.9%. The market recorded 427,651 SF of positive quarterly absorption and 613,222 SF of positive year-to-date absorption. The construction pipeline totaled 952,490 SF, with activity concentrated in select highway-accessible and development-ready locations. Advanced manufacturing, energy, clean technology and large-scale infrastructure investment remain important long-term demand drivers for the region. Conditions continue to favor modern, functional product, while older or less efficient buildings face more selective tenant demand.
RETAIL – Retail fundamental remained stable in the second quarter, with limited movement in occupancy and modestly negative demand indicators. Availability held at 5.4%, while total vacancy declined from 4.6% in Q1 to 4.4% in Q2. The market recorded 7,385 SF of negative year-to-date absorption, while construction actively totaled 309,503 SF. Well-located suburban and neighborhood-serving space continued to attract steady interest, supported by limited new supply. Downtown activity increasingly centered on public-realm investment and the reuse of long-vacant storefronts, while established suburban centers continue to draw investment and repositioning capital. Performance remains uneven across legacy formats and submarkets, but the sector’s overally occupancy profile continues to be comparatively stable.